report
Uber Takes Us for a Ride
Data shows Uber cries wolf about driver pay, while jacking up fares and paying off Wall St
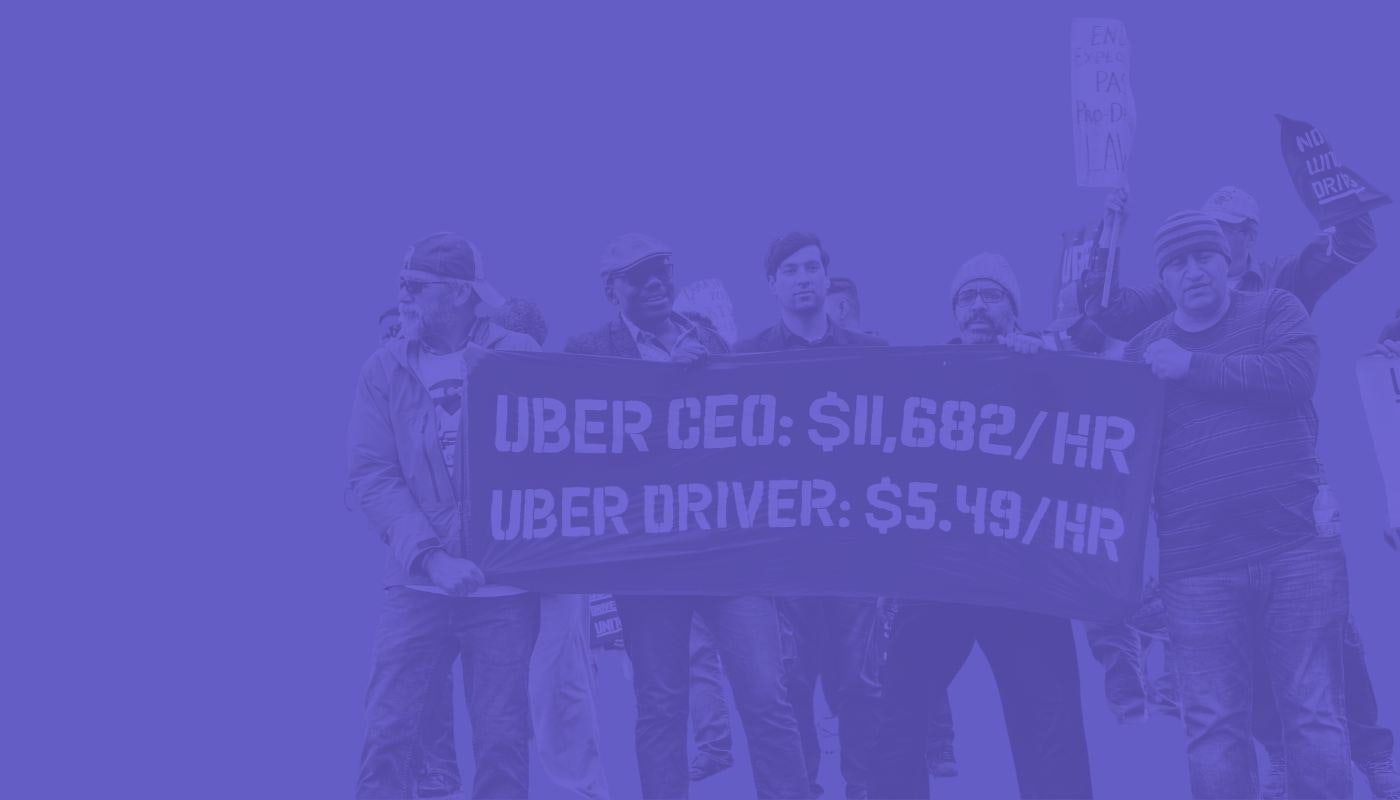
In city after city that considers pay protections for rideshare drivers, Uber and Lyft trot out the same fear-mongering line: Fair pay for drivers will cause passenger fares to spike to unaffordable heights.
In New York City, which put in place the first driver pay standard in the nation in 2019, Uber claimed it would “lead to higher than necessary fare increases for riders.” When Seattle considered a fair pay proposal for drivers, Uber declared it would “nearly double rideshare rates.” Lyft spun a similar tale in Chicago, warning that a fair wage standard would end up “more than doubling the cost of rides.” In Minnesota, Uber was at it again, dubiously stating that driver wage protections would increase fares by 30%. These purported concerns are part of Uber and Lyft’s larger public relations strategy to position themselves as defenders of accessibility for low-income communities and communities of color, and champions of racial justice.
We decided to test these claims. We analyzed publicly-available records of over 1 billion rideshare trips hailed in New York City and Chicago, two of Uber’s top 5 markets globally. While market share data for Chicago are not available, nationally and in New York City data indicate that together Uber and Lyft have nearly 100% of the rideshare market. We compared the change in the average base fare paid by rideshare passengers over four years, during which time New York City had a pay floor for drivers, while Chicago did not.
If Uber and Lyft are right, we would expect to see fares rising faster or by more in New York City than in Chicago. But though rideshare fares have risen considerably in recent years, our new findings, together with prior research, suggests the driving force behind these increases is investor pressure, not fair wage standards. And it appears investors are reaping the rewards: in February 2024, Uber announced its first-ever annual profit and a plan to spend $7 billion on stock buybacks.
Here’s what we found.
Data on 1 billion rides in Chicago and New York shows that Uber and Lyft raised fares more in the city where drivers have no pay protections.
Mean Rideshare Base Fare
Source: NYC Taxi and Limosine Commission High Volume For-Hire Vehicle (HVFHV) trip record data and Chicago Transportation Network Providers (TNPs) trip data.
Let’s first look at New York City, where there was a 36% increase in the average base passenger fare during the period we examined.
New York City collects data on fare prices for individual rideshare trips. Here’s how the average trip cost changed between February 2019, the first full month after the city implemented a floor on pay per trip for drivers, and February 2023. During those four years the City increased the pay minimum three times to account for rising living costs.
(It is important to note that New York also placed a “pause” on issuing new rideshare licenses in August 2018 in order to improve platform utilization, and Uber has repeatedly said such freezes will likely spike fares.)
At first glance, it looks like Uber and Lyft hike fare prices each time the annual pay floor is increased.
But compare fare hikes in New York City with those in Chicago, which hasn’t enacted driver pay protections.
In Chicago, the average fare rideshare corporations charged rose by 54% over the same four years — significantly more than in New York City. And the spikes and dips in fares look remarkably similar in the two cities.
This belies the scare tactics from Uber and Lyft that higher wages are the reason for the fare hikes.
And while Uber is fighting pay laws with dubious claims, research shows that the rideshare corporation is quietly pocketing more and more of the swelling passenger fare, leaving drivers with a shrinking cut, even as fuel and vehicle costs increase. An independent analysis of Uber’s own financial disclosures revealed that while revenue per trip has increased in recent years, the corporation is pocketing more and more of the fare. And new research shows that driver pay is falling — in 2023 Uber drivers in the U.S. made 17% less on average than they did in 2022, despite working just 3% fewer hours.
What about Uber and Lyft’s purported concerns about racial equity? Not only have fares soared in general, but researchers at George Washington University analyzed over 100 million rides between November 2018 and September 2019 and found that rideshare pricing practices lead to "racially-based price disparities” and that Chicagoans paid more if they were being picked up or dropped off in predominantly non-white neighborhoods.
So what’s really behind these rising fares?
It’s not a driver shortage.
The number of rideshare drivers has risen nationally as well as in our studied cities since the early days of the pandemic, which had seen falling demand and a related decrease in driver supply.
In April 2020, the number of drivers in Chicago hit a low of about 17,000 active drivers. The number of drivers rose to nearly 47,000 active drivers as of February 2023. In New York, the number of drivers dipped to about 22,000 in April 2020. And like Chicago, the number of drivers has risen steadily in New York and in February 2023 there were just over 77,000 active rideshare drivers in the market.
In 2018, the City of New York implemented a pause on issuing new rideshare licenses while the City studied the impact of unregulated licensing on congestion, driver pay, and passenger wait times. Twice-a-year evaluations by the City over the past four years have found that the number of for-hire vehicle drivers has sustained stable average wait times for passengers of between 4.5 to 6.6 minutes since 2018, an indicator there is no driver shortage in New York.
Uber seems to agree that there is no shortage: "The demand is there and the supply is there to continue to provide a great service for people wanting a ride,” Uber CEO Dara Khosrowshahi said in a recent interview.
And yet fares have continued to rise.
Median Rideshare Trip Length
Source: NYC Taxi and Limosine Commission High Volume For-Hire Vehicle (HVFHV) trip record data and Chicago Transportation Network Providers (TNPs) trip data.
It’s not longer trips.
We also checked median miles per trip in NYC and Chicago to see if the distance passengers traveled had trended up over the four years analyzed, perhaps explaining the higher fares.
But that figure barely budged over the four years we looked at. We found that median trip distance decreased by just 3% in New York City and increased by 3% in Chicago.
Percent Change in Inflation and Fares
It’s not just inflation.
When confronted with the exorbitant price hikes facing rideshare passengers, Uber CEO Dara Khosrowshahi has tried to blame inflation, saying in 2023 “everything is more expensive.”
Uber’s head of mobility recently told investors that “overall, UberX prices have grown slower than inflation, and we plan to keep prices as low as we can to grow the category."
However, we found that in the two major US markets we examined, average rideshare fares outpaced the 19% gain of inflation over the 49 months we examined, by three times in Chicago and two times in New York City. Another recent analysis by Forbes found that Uber fares across the U.S. have increased annually four times faster than inflation.
The Answer: Fare hikes appear motivated by investor pressure
If fares are increasing yet drivers are seeing a smaller and smaller cut, then where is all that money going? Let’s take a closer look at the story of Uber, since it dominates the U.S. rideshare market.
For years, Uber lured the world with impossibly low passenger fares and easy driver earnings, all bankrolled by billions of dollars of venture capital from the likes of Goldman Sachs, BlackRock, Jeff Bezos, and the Saudi government. These artificially low prices and subsidized wages allowed the corporation to vanquish competition, sign up millions of customers, and ultimately corner the market in major cities.
In 2015, according to one analysis, Uber passengers were only paying 41% of the actual cost of their trips. In the subsequent years, the corporation continued this growth-over-profit model, posting losses in the billions and using accounting tricks to juice up its balance sheet to keep the firehose of investment cash flowing. Investors were promised Uber would become the “Amazon of Transportation.” And the ruse worked. By the time of its public offering in 2019, Uber had become the most highly valued private startup of all time.
Uber's Push for Profits
Since going public in May 2019, the corporation has come under considerable pressure from investors to turn a profit and deliver returns. In February 2020, Khosrowshahi told investors that the firm “recognize[s] that the era of growth at all costs is over” and projected Uber would turn a profit by the end of that year.
The pandemic put both Uber’s plans and investor expectations in question for a period, but by August 2021 Uber’s report of growing losses spurred investors to unload shares and analysts to raise concerns.
Uber has responded by jacking up its fares and keeping more of those fares. Our analysis of Uber’s financial disclosures show that since the corporation went public, average fares have increased by 65% while at the same time Uber’s share of the fare has increased. This has led to a transfer of over $1 billion in revenue per quarter from drivers to Uber shareholders.
And after 14 years and $33 billion in losses, Uber finally announced its first-ever annual profit on February 7, 2024.
While the party may be over for workers and customers, it’s just beginning for investors.
On Valentine's Day this year — as workers around the world took action for better pay, fairness, and safety — Uber announced it would spend $7 billion on its first-ever stock buyback program. Wall Street responded, sending the stock price up 12% to an all time high and applauding executives.
"Uber is hitting on all cylinders and has decided it's time to return capital back to the owners," said Thomas Hayes, chairman of hedge fund Great Hill Capital. "It's a vote of confidence in demand for their services as well as operational discipline perfectly executed by CEO Dara Khosrowshahi."
A buyback is when a corporation buys up its own shares from shareholders, which often diverts money away from its labor force. This type of self-dealing benefits corporate executives and wealthy shareholders at the expense of workers.
Don’t Fall for Uber’s Lies
Ultimately, this is a simple story of Wall Street greed. Uber is charging passengers more while paying drivers less, allowing it to hand more money to the banks and billionaires demanding it show profits.
This price gouging and worker exploitation is part of a bigger story, one that is familiar to anyone living through The Great Tech Reckoning. Uber is one of many money-burning tech disruptors that initially promised cheaper, more convenient alternatives but now want to squeeze users and workers to turn a profit on their bait-and-switch business model. This is known as predatory pricing.
Falsely claiming that wage protections will drive up fares seems to be a tactic Uber and Lyft use to pit drivers against consumers and obscure this massive upward transfer of wealth. Uber has long appealed to passengers to oppose regulations that would provide various protections to drivers, in addition to spending tens of millions of dollars on lobbying elected leaders directly. But the reality is that Uber’s predatory scheme harms both customers (by first eliminating alternatives and now charging higher and higher fares) and drivers (by paying low wages that force drivers to work more hours and accept unsafe rides to make ends meet).
Over the last decade, a combination of unrelenting spin, aggressive lobbying, and venture capital have allowed Uber to largely displace taxis, which have regulated fares. This means that the average person has little choice but to pay whatever Uber and Lyft demand, and those who are in areas with inadequate public transit have even fewer options. In the end, Uber hopes to pull all transportation modes into its app, including taxis and public transportation. The corporation’s mission is to become “the operating system for your everyday life.”
Despite this, the future of transportation in our cities is far from settled. Instead, efforts to set pay and other standards are continuing in the face of industry opposition, with the cities of Chicago and Minneapolis currently considering driver pay standards. Drivers are demanding a new route for the industry, one where workers are paid fairly, riders have affordable transportation options, and Uber is no longer taking us all for a ride.
Notes
Data Details
The NYC fare data are from the City’s Taxi and Limousine Commission’s High Volume For-Hire Vehicle (HVFHV) trip database. The TLC defines High HVFHs as operators that dispatch more than ten thousand (10,000) trips per day, distinguishing them from small, traditional car services.
The Chicago fare data are taken from the Transportation Network Providers (TNPs) - Trips (2018 - 2022) and (2023) datasets. The CIty of Chicago defines TNPs as companies that provide pre-arranged transportation services for compensation through an Internet-enabled application or digital platform to connect passengers with drivers of vehicles for hire.
These datasets are publicly available and include information about individual trips, including passenger base fare, trip distance, trip time, and pick-up and drop-off locations.
The NYC data prior to February 2019, before the city’s pay standard went into effect, are sparse and do not include information about fares. Therefore, we could not extend the passenger fare analysis to previous years.
Chicago rounds their fare data to the nearest $2.50 while NYC includes the true value. Fees charged by rideshare providers outside of the base passenger fare could not be considered in the analysis because Chicago combines these costs with taxes and other government-imposed fees into a single column labeled “Additional Charges.”
The New York City data on number of drivers is from the City’s Taxi and Limousine Commission’s aggregate report of Yellow Taxi, Green Taxi, and For-Hire Vehicle (FHV) Monthly Data. The Chicago data on number of drivers is from the City’s Transportation Network Providers Drivers by Month data set.
Methodology
Trips that were 0 miles, 0 seconds long, or listed a fare of $0 were excluded since these were likely erroneous or canceled trips. Trips that lasted over five hours were also removed. Because the New York City data does not include trips that began or ended outside the city limits, we excluded those types of rides from the Chicago dataset as well. The New York City data lists the taxi zone where each trip began and ended. Trips listing an “unknown” taxi zone for either pick-up or drop-off location were removed. We also excluded trips showing driver pay of $0 in New York City. We were unable to do the same for Chicago since its publicly available data does not include driver pay per trip, although the city requires rideshare companies to report this information.
We found that fares in both cities fluctuate seasonally. To mitigate the potential confounding effects of seasonality, which Uber has acknowledged in its financial filings, we constrained the scope of our analysis to encompass four full years, beginning in February 2019 and ending in February 2023. Because there is a two-month lag time for New York City data to be made publicly available, we were not able to extend the analysis to February 2024 by the time of the publishing of this report.
Because Chicago rounds fare to the nearest $2.50, we opted to use the mean to compare changes in fare over time between the two cities. Mean-based measures were less influenced by the rounding because they use all of the data available rather than finding the middlemost number. We tested this by taking the first and last months of New York City fare data and rounding them to the nearest $2.50 (similar to Chicago). We found that the mean was barely affected while the rounding made a dramatic difference to the median. However, even when looking at the change in median fare in the two cities, it is still higher in Chicago (67%) than in New York City (50%).
A combined total of 1,087,048,342 trips were included in the original datasets and, of those, 1,003,381,558 trips were analyzed for a total exclusion rate of 7.7%. The Pandas Python library was used to prepare and analyze the data. We also had an independent data expert review the methodology and code to verify the analysis.
To identify the number of active drivers in each city we counted drivers who had taken at least one trip in the given month, to avoid inflating driver figures with licenses not actually in use in the market.
To measure the change in inflation over the time period we analyzed, we calculated the change in the Consumer Price Index For All Urban Consumers put out by the U.S. Bureau of Labor Statistics.
Per-mile median fares
We also looked at the average fare on a per mile basis in both cities. Looking at it this way, over the four years we analyzed, the average fare per mile increased in New York City by 35% and in Chicago by 43%. The lack of transparency or consistency in rideshare pricing makes it difficult to know why the rate of increase for average fare differs from average fare per mile, as what Uber and Lyft charge per mile may change from ride to ride based on any number of factors including but not limited to responding to or controlling for supply and demand, local conditions such as weather or traffic, business strategies to maximize revenue per mile, tests to adjust pricing algorithms, and so forth.
Credits
In addition to PowerSwitch Action staff, this project was made possible by the following contributors:
Data analysis: Kevin Flores, Small World Strategy
Methodology and analysis review: Emily Oxford
Data visualization and design: Lo Benichou
Endnotes
While the datasets from both New York and Chicago may include rides provided by other entities (like Via), Uber and Lyft together comprise nearly the entire US rideshare market and for this reason our analysis is that trends in pricing are driven by these two corporations. Uber’s dominance suggests it has significantly more influence on pricing than competitor Lyft. In 2023, CNN reported that Uber had 74% of the market nationally and Lyft had 24%. This holds true in New York City: according to publicly available data, Uber has had 74% of the rideshare market in New York City since 2019 and Lyft has had 25%, with all other providers accounting for less than 1%. The City of Chicago does not provide the same detail on market share.
Exactly how much take rates are rising — and vary from ride to ride — is ripe for further study. Uber’s financial disclosures show that Uber increased take rates from 23.5% to 28.7% between Q1 2022 and Q4 2023 (most recent available). See quarterly result press releases available here (note: Uber calls the take rate “revenue margin”). One independent analysis has estimated Uber now keeps 40% of fares, which Uber denies. A study of New York City take rates found take rates doubled between 2019 and 2022 and that there was substantial variation in take rates across rides. Drivers have reported take rates over 50%.
